TLDR: How to profile Cloudflare workers with wrangler
I recently profiled Cloudflare(CF) worker for Easyanalytics. Some of the existing approaches that I'm accustomed to, such as measuring time, did not work with it. Therefore, I decided to share my learnings.
Need for profiling
Cloudflare functions have limits on CPU time and total function completion time(in case of external network requests that are not CPU-bound). If a function exceeds these limits CF gives timeout errors. This could result in a disruption of service. Therefore, it is crucial to ensure that the application is architected to stay within the limits specified by CF.
Common approaches that do not work
The most common approach to measure time is to simply calculate the time difference between the start and end of the code of interest. Unfortunately, this method will not work for Cloudflare (CF) functions. This is because CF does not update time within the function execution unless there is an I/O request. This measure was implemented to mitigate timing side-channel attacks, making it unlikely to change in the foreseeable future. Consequently, this rules out any ideas you may have in mind regarding Date.now, console.time, performance.now, etc.
If you're considering the use of delay() to update the time, as it might induce a context switch, it's worth noting that this approach won't work either. Similarly, using promises is also ineffective for updating time within Cloudflare functions.
Introducing a fetch will indeed work in updating time since it involves an I/O request. However, the results are likely to vary widely, making it almost useless for profiling purposes
Profiling with wrangler
You can profile functions locally by using wrangler. CF provides integration of wrangler with chrome dev tools.
Run following command in your terminal
wrangler pages dev --local out/This will result in following output

press d to open chrome dev tools
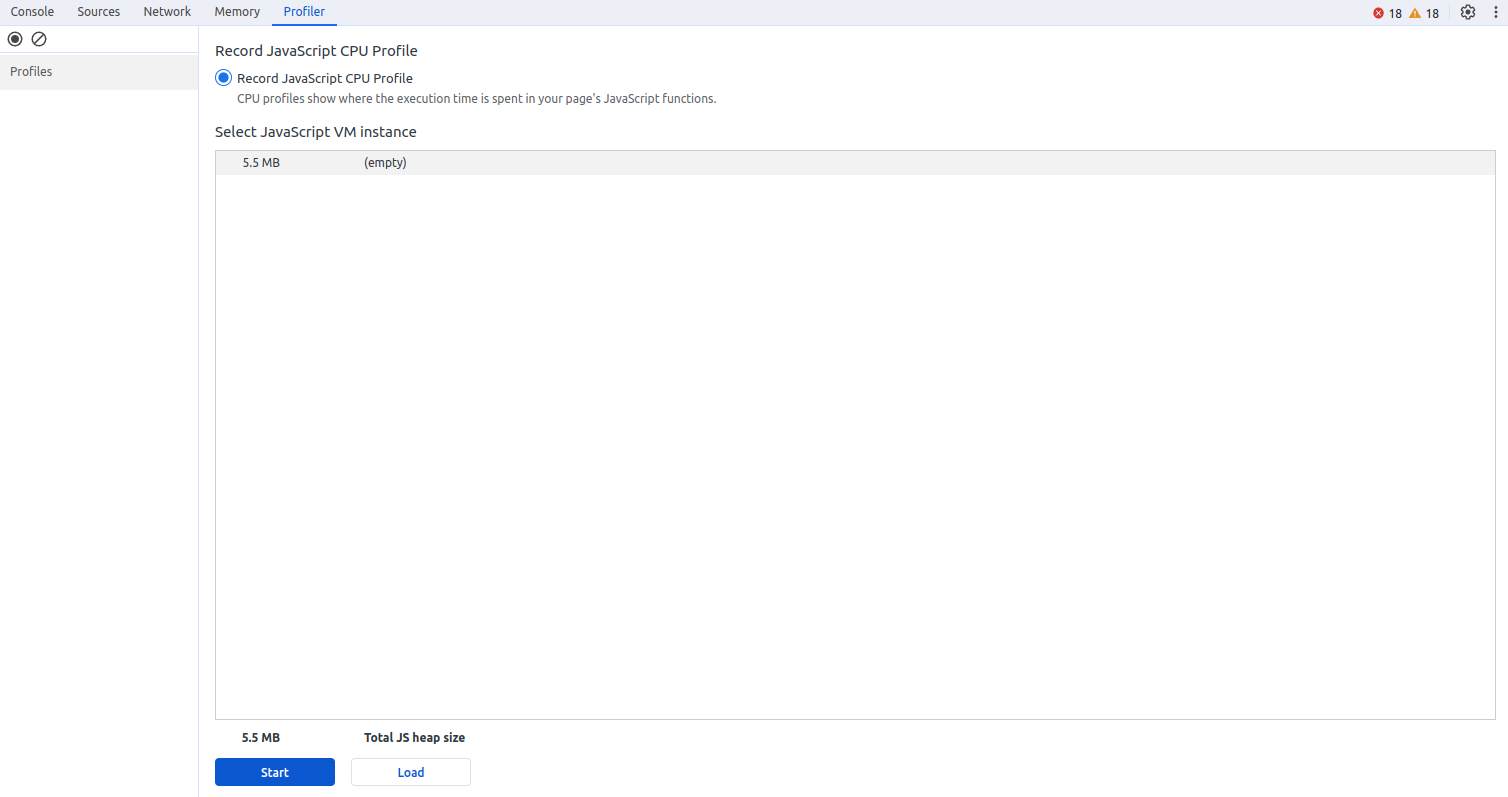
press start button to start profiling and invoke your worker
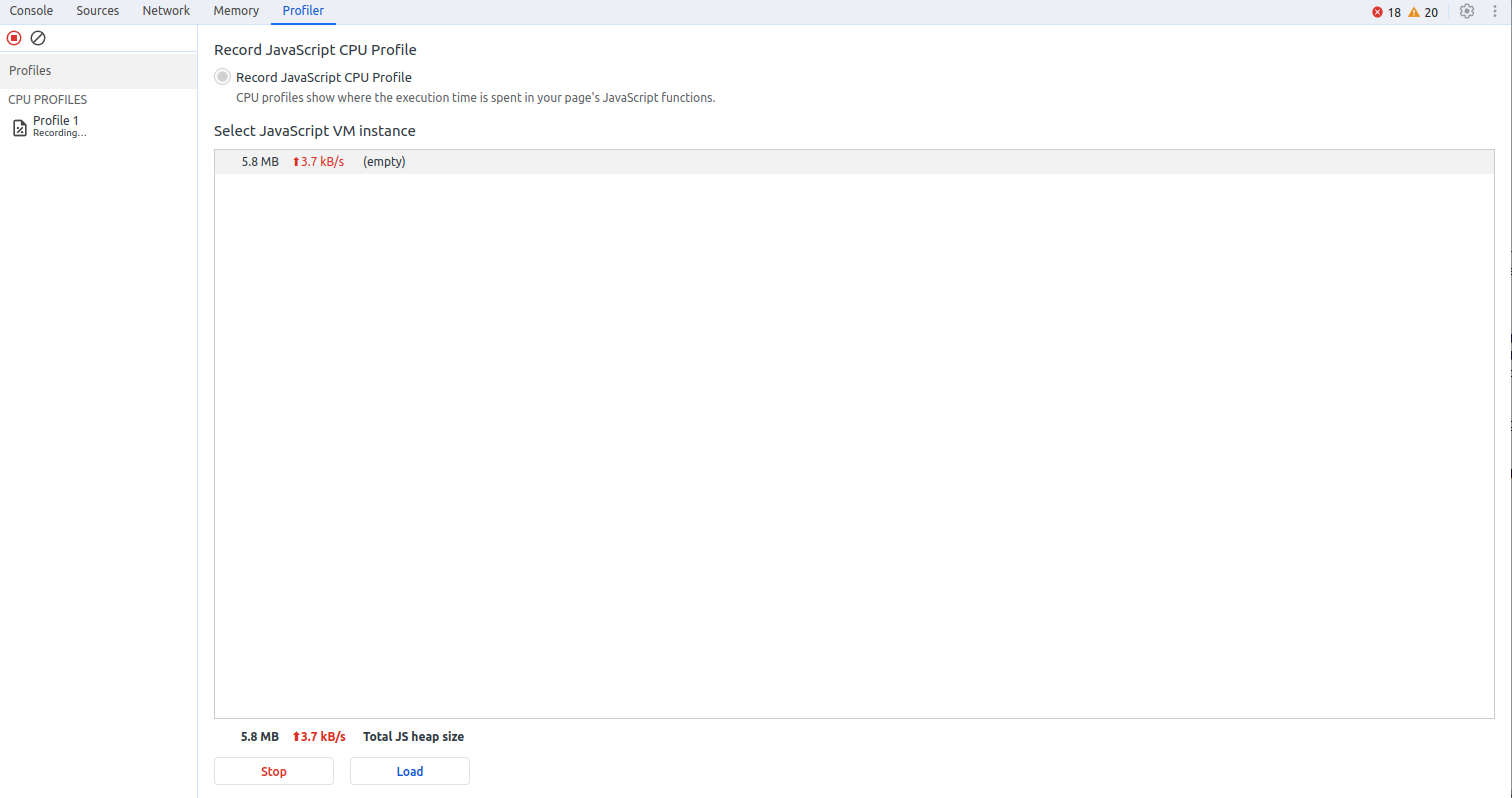
press stop button to stop profiling. When you stop profiling you will get the following in profiler tab of chrome dev tools
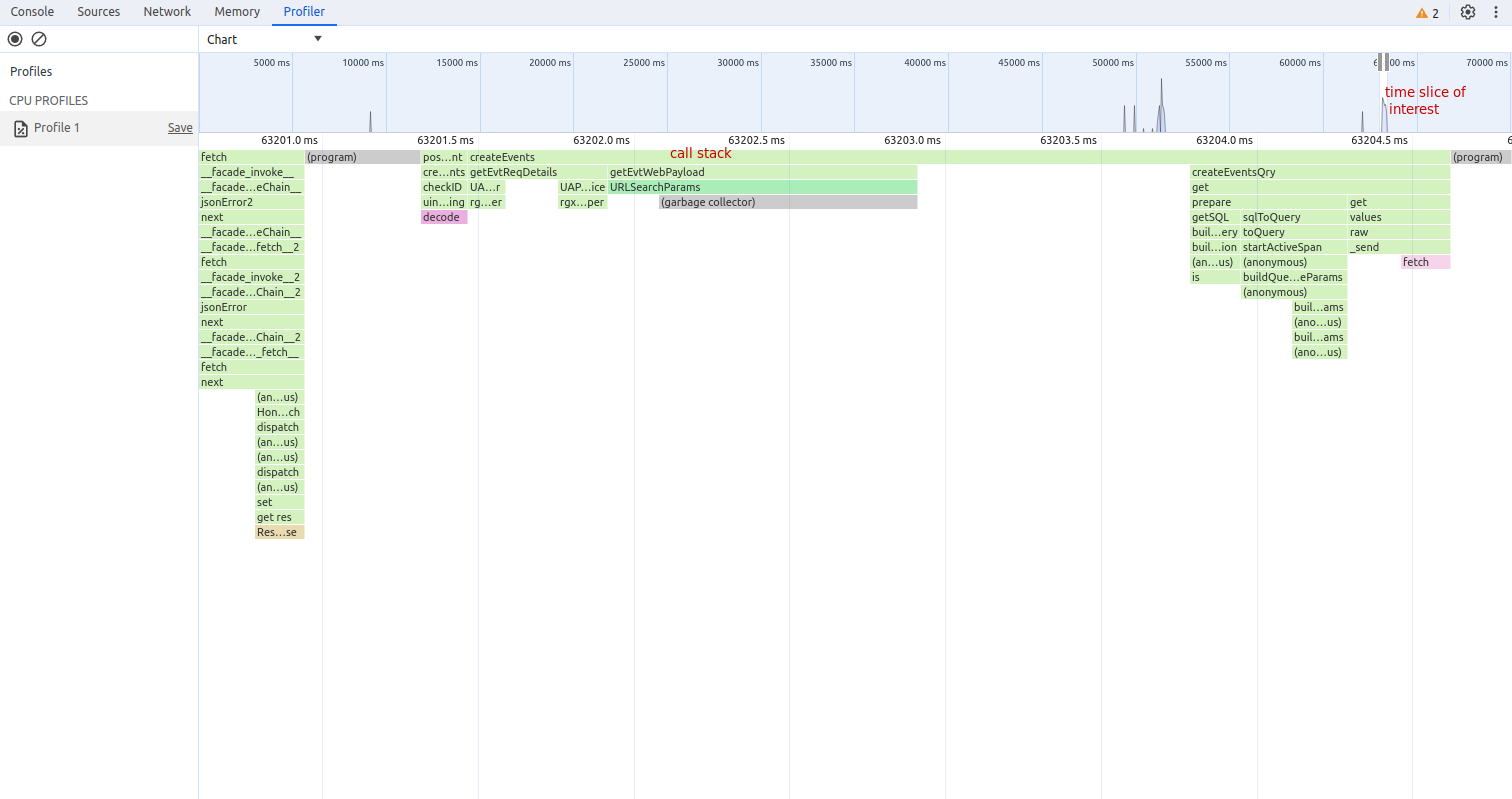
Depending on how your application is written, you may receive multiple calls to the worker, as evident in the timeline spikes. To focus on the specific code of interest, carefully select the timing associated with it on the timeline. In the provided diagram, I've chosen the timeline near 63204.5 ms, marked in red as the 'timeline of interest.' This selection provides detailed call stack information corresponding to the chosen timeline, indicated in red as the 'call stack'.
X-axis corresponds to the time spent in function this includes time spent on functions called by the parent function. Y-axis corresponds to the callstack. If you hover your mouse over any function you will get detailed timing as shown below
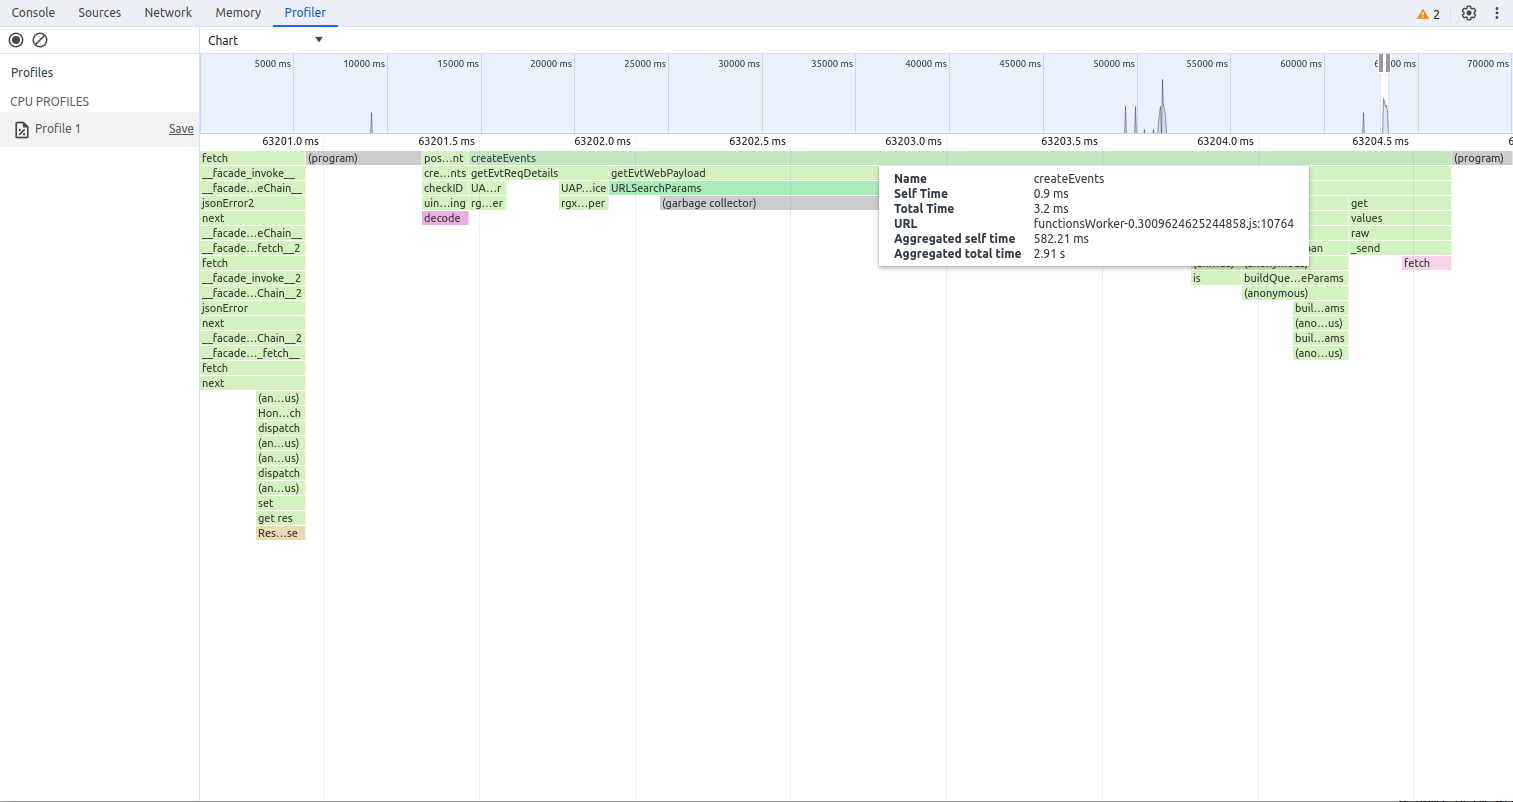
Here is the definition of these fields for quick reference chrome reference
- Self time: How long it took to complete the current invocation of the function, including only the statements in the function itself, not including any functions that it called.
- Total time: The time it took to complete the current invocation of this function and any functions that it called.
- Aggregated self time: Aggregate time for all invocations of the function across the recording, not including functions called by this function.
- Aggregated total time: Aggregate total time for all invocations of the function, including functions called by this function.
While this will help you in getting the relative time spent by different parts of code in a worker, it's important to note that this will not give you accurate time since the timing is generated locally on simulator. It also does not takes into account certain hardware optimizations that are present in CF worker runtime. For example, CF workers utilize optimized crypto functions that leverage underlying hardware, this not available when invoking the worker locally.
This implies that the profiler cannot be reliably used to predict whether your worker will avoid timing out in actual deployment
Profiling with CF function metrics dashboard
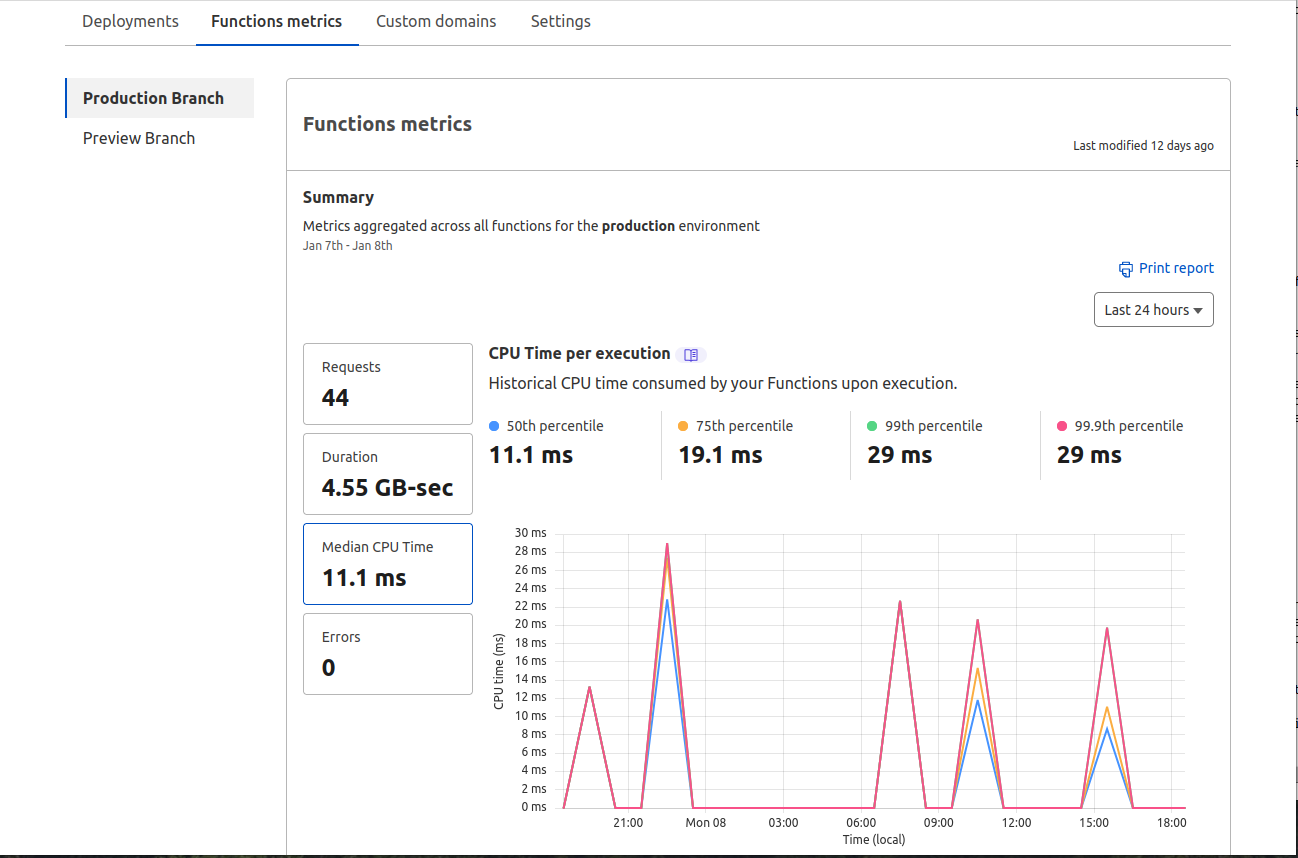
As local profiling cannot provide accurate timing for Cloudflare (CF) workers, an alternative is to isolate the code of interest in a separate worker, if possible. Then, utilize the median time field in the CF function metric to obtain more accurate timing. While not an ideal solution, this approach comes closest to providing the actual timing in a deployed environment.
Lessons learned
We learned how to use wrangler and chrome dev tools to profile workers locally. At present there is no way to get accurate timing of worker in CF.

